- Role: Solo. Concept, design, front end, backend, data processing and deployment.
- When: Spring 2025 (the map, for Networked Media) and Spring 2026 (the data essay, for Information Design)
- Stack: React, React Router, Vite, Leaflet, MapTiler, Firebase (Firestore, Storage), D3, GSAP ScrollTrigger, Lenis, Node.js, nginx, GitHub Actions
- Exhibited: NYC PIT Pop Up at the World Trade Center, April 2026
- Live: poop.nyc (the map) and the data essay
The idea
The brief for Networked Media was a community website. I pitched a landing page for the IMA/ITP Open Source Club. Then I talked to the club president, and it turned out they didn’t need one. Neither did I. It felt painfully dull.
A few days later I stepped in dog poop on a Brooklyn sidewalk. Full weight, no warning. The shoe was finished, and the project was decided.
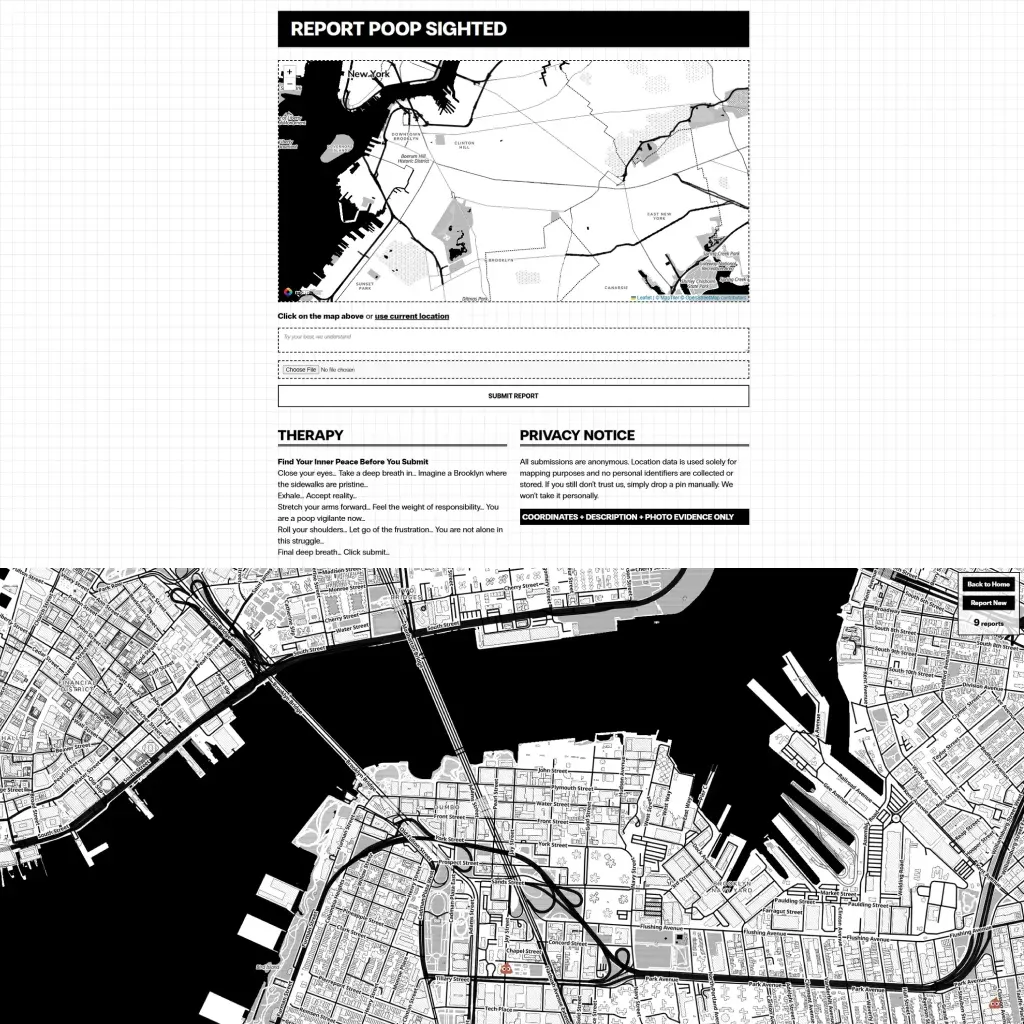
The Brooklyn Poop Map lets anyone pin a sighting. Its community, The Watch Your Step Society, is half fictional and half real: anyone who submits a pin is a member. The references were the San Francisco poop map and useless websites like paper toilet .com, which convinced me the site needed a counter that only goes up.
A map that looks like a newspaper
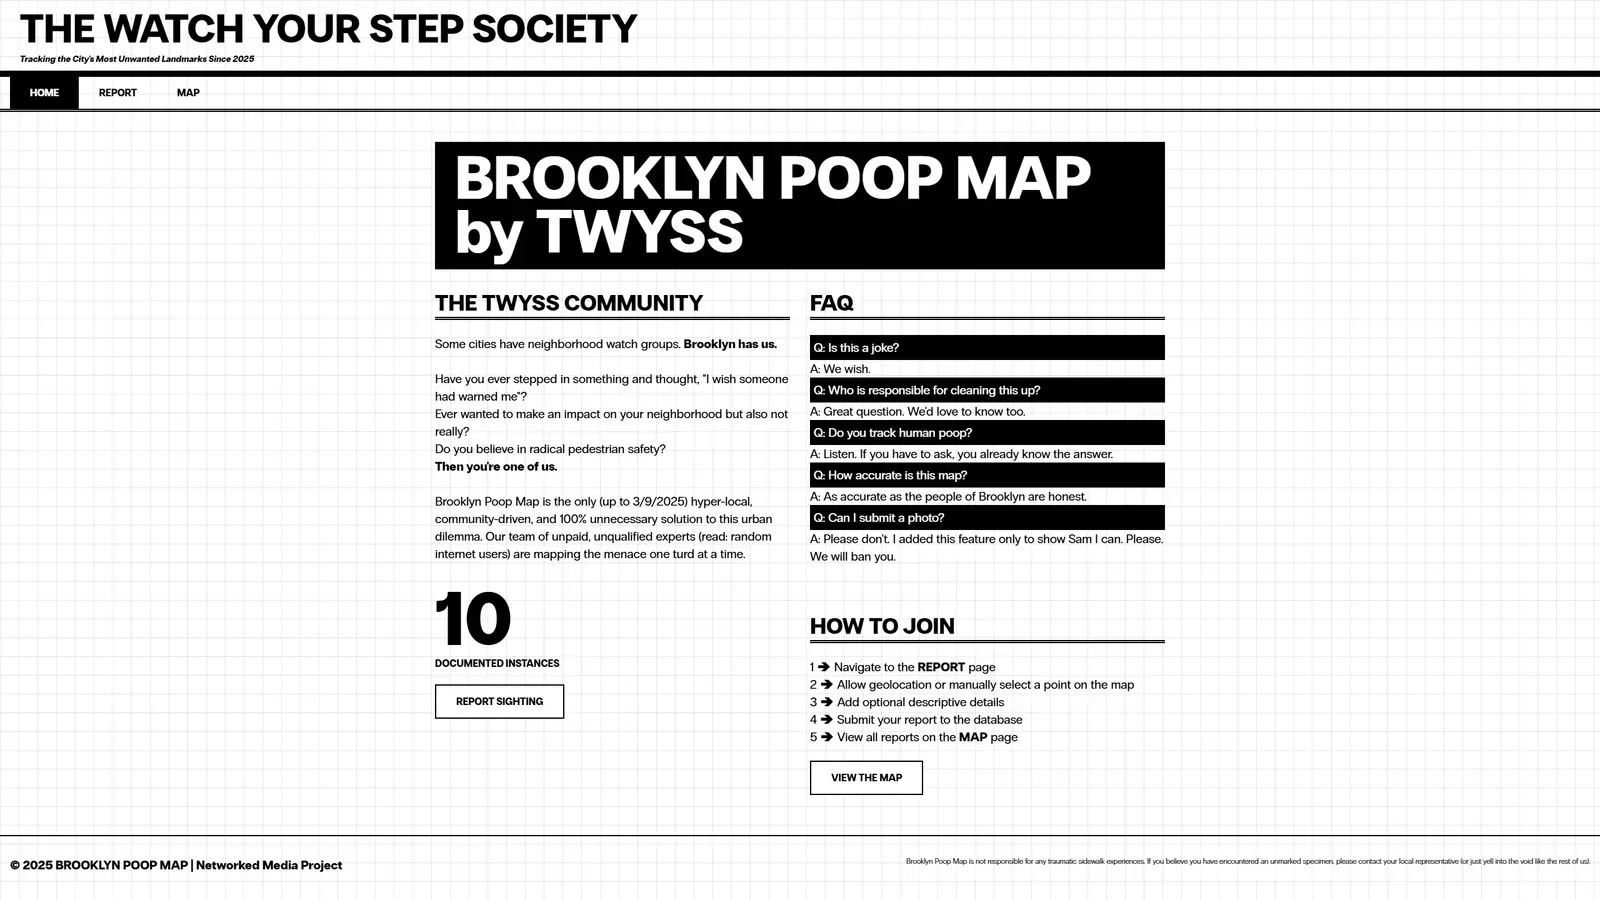
I wanted the site to read as both a public service announcement and something weird enough to click. That meant black and white, inverted headlines, bordered buttons that flip to black on hover, and a graph-paper grid behind everything.
The default OpenStreetMap tiles broke that completely. Restyling them meant running a tile server or learning a styling toolchain, which was a lot of work for one look. I switched to MapTiler and its Toner style, a high-contrast black-and-white map originally from Stamen Design. It is one API call, and it looks printed.
The map page went through three layouts: cramped inside the site’s fixed-width column, then positioned absolutely and still wrong, then fullscreen like the San Francisco map, with the header hidden and navigation in a small floating panel. The whole point is to show the map.
Reporting a sighting
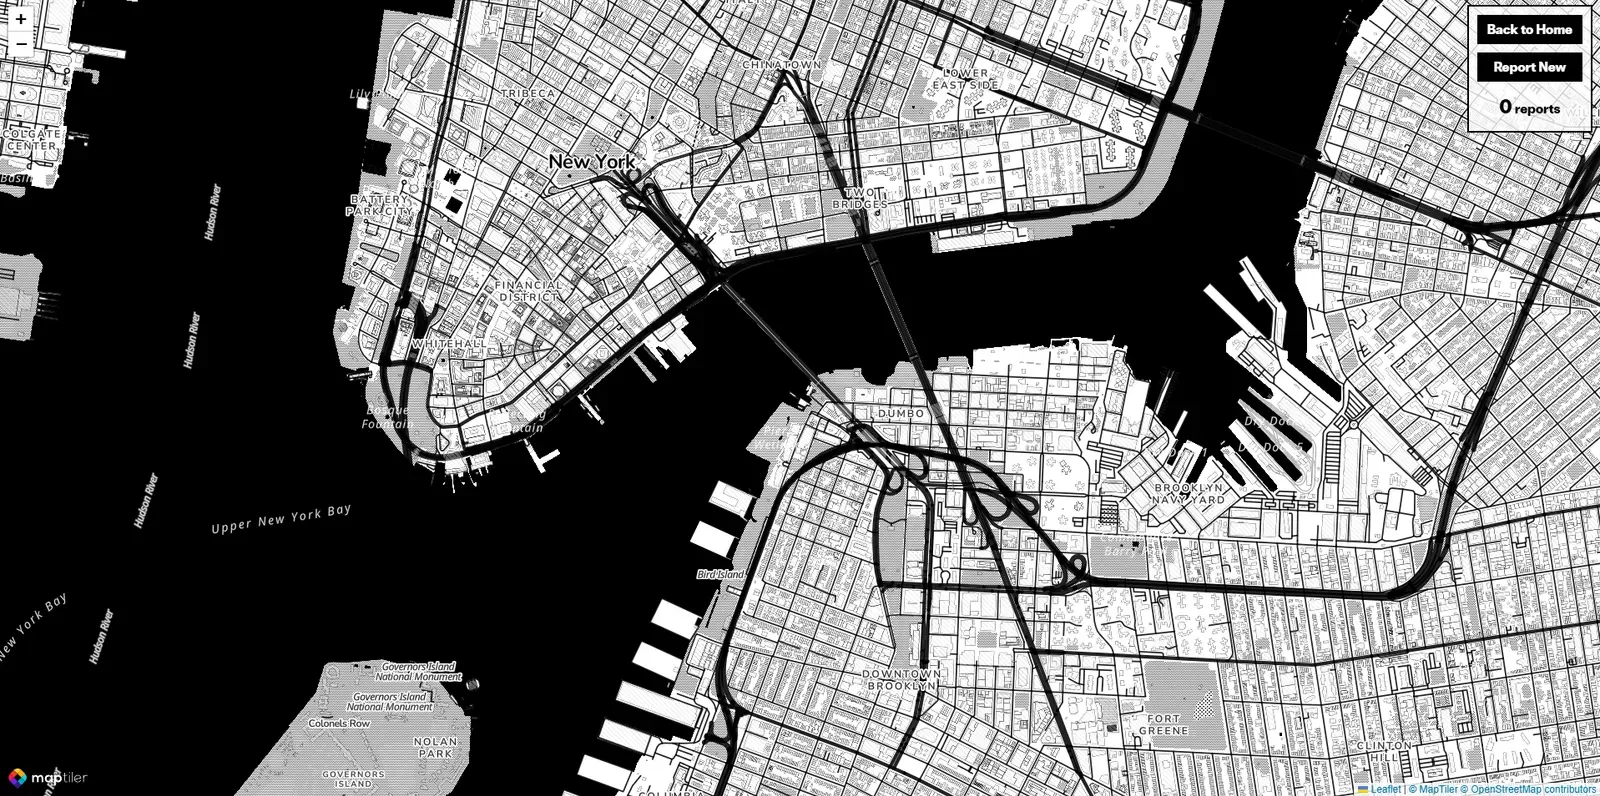
A report is a location, a short description, an optional photo and a timestamp. Picking the location had to work on any device, so you can click the map to drop a marker or press “use current location” to use the browser’s geolocation. If that is denied, you drop the pin by hand. Each pin on the main map opens a popup with the description, the photo and when it was reported.
The first version ran on Express and EJS. Later I rebuilt it as a React single-page app with Firebase: reports go to Firestore, photos to Firebase Storage, and the app checks that the coordinates are real numbers and the description isn’t empty before anything is written. No server code of my own left to maintain.
One thing I never solved in the class version was locking the map to Brooklyn. Without it, the Brooklyn Poop Map is technically a worldwide poop map, and my friends in Shanghai could contribute too. It is now the NYC Poop Map.
From anecdotes to open data
Pins tell you where people stepped in something, not why. So I started a second piece for Information Design: a scrolling data essay on why New York sidewalks look the way they do.
A Node script reads six NYC Open Data exports (311 dog-waste complaints, the DSNY litter basket inventory, zip code boundaries, dog licenses, street cleanliness scorecard ratings and SweepNYC street cleaning logs) and writes compact JSON and GeoJSON for the browser. The 311 export covers every “Dirty Condition” complaint, so the script filters it down to dog waste. Locations arrive as WKT text, so I wrote small parsers for points and multipolygons instead of pulling in a GIS library. Points are stored as bare number arrays to keep the files small.
The essay runs about 18 sections, each with its own chart module loaded on demand. A few of them:
| Section | Data | What it shows |
|---|---|---|
| Tale of two cities | 311, zip boundaries | Upper East Side and Brownsville side by side |
| Infrastructure desert | 311, litter baskets | A complaint heatmap, then every public basket, then the zips with the most reports per basket |
| Broken Windows cascade | Scorecard ratings | Districts with the steepest drop in sidewalk cleanliness |
| SweepNYC | Sweep logs, 311 | When sweepers work versus when complaints come in |
| MS4 runoff | Harbor water samples | Bacteria levels on wet days versus dry days |
The layers are tied to scroll position. In the infrastructure section, the heatmap, the baskets and the ranked zips fade in one at a time as the reader reaches each paragraph, so the argument builds in the same order as the text. GSAP ScrollTrigger handles the timing, Lenis smooths the scrolling, and the maps reuse the same Toner basemap as the main app.
Shipping it
Both pieces deploy together. Pushing to main runs a GitHub Actions workflow that builds the essay and the React app, syncs them to a DigitalOcean droplet with rsync, then installs and reloads the nginx config. nginx serves the app, serves the essay under /poop-map-scrolly/, and caches static assets and data files for a year, since they only change on deploy.